How Does UMPI Work?
Based on over 20 years of observation and analysis of stock markets coupled with our own investment experience, we invented the Universal Market Predictor Index (UMPI) – a reliable stock market prediction tool. UMPI is calculated using a proprietary technology and can accurately predict significant trends in stock market movement.
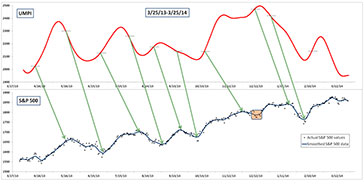
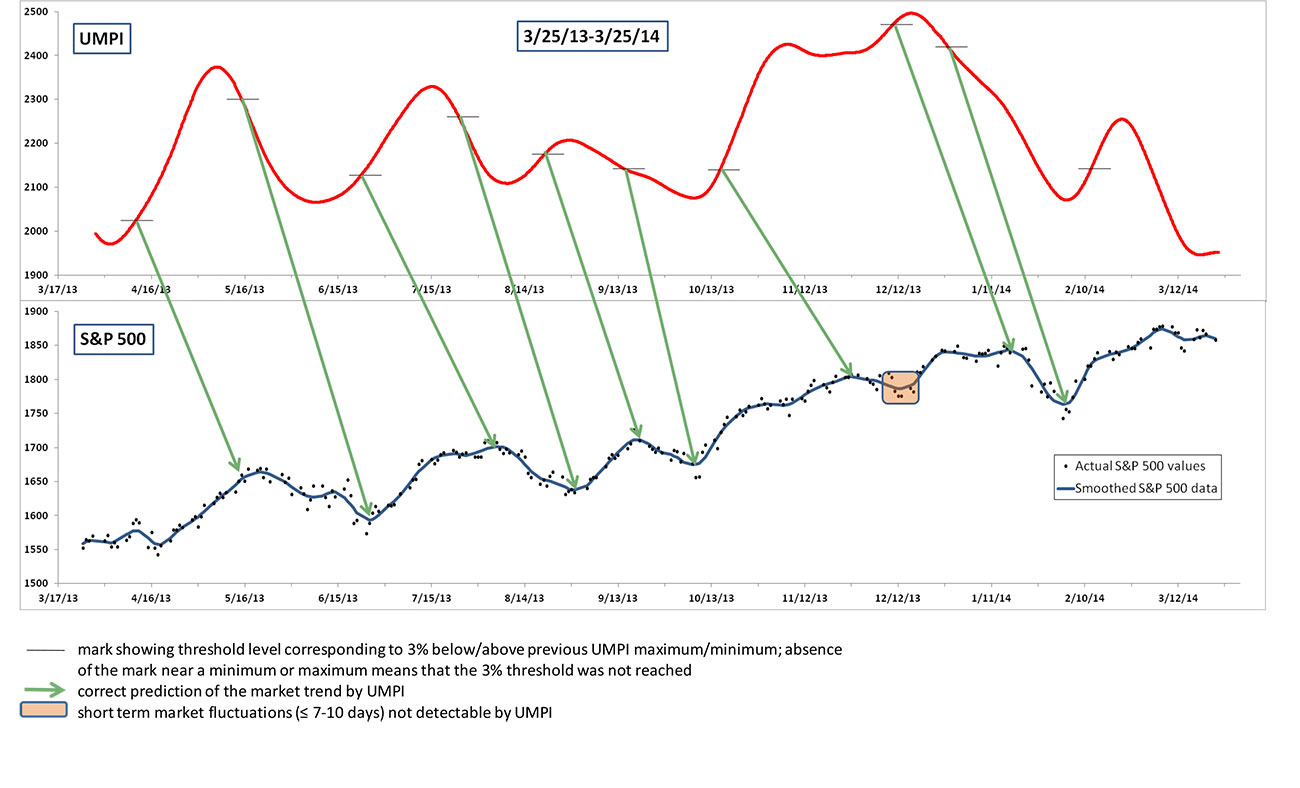
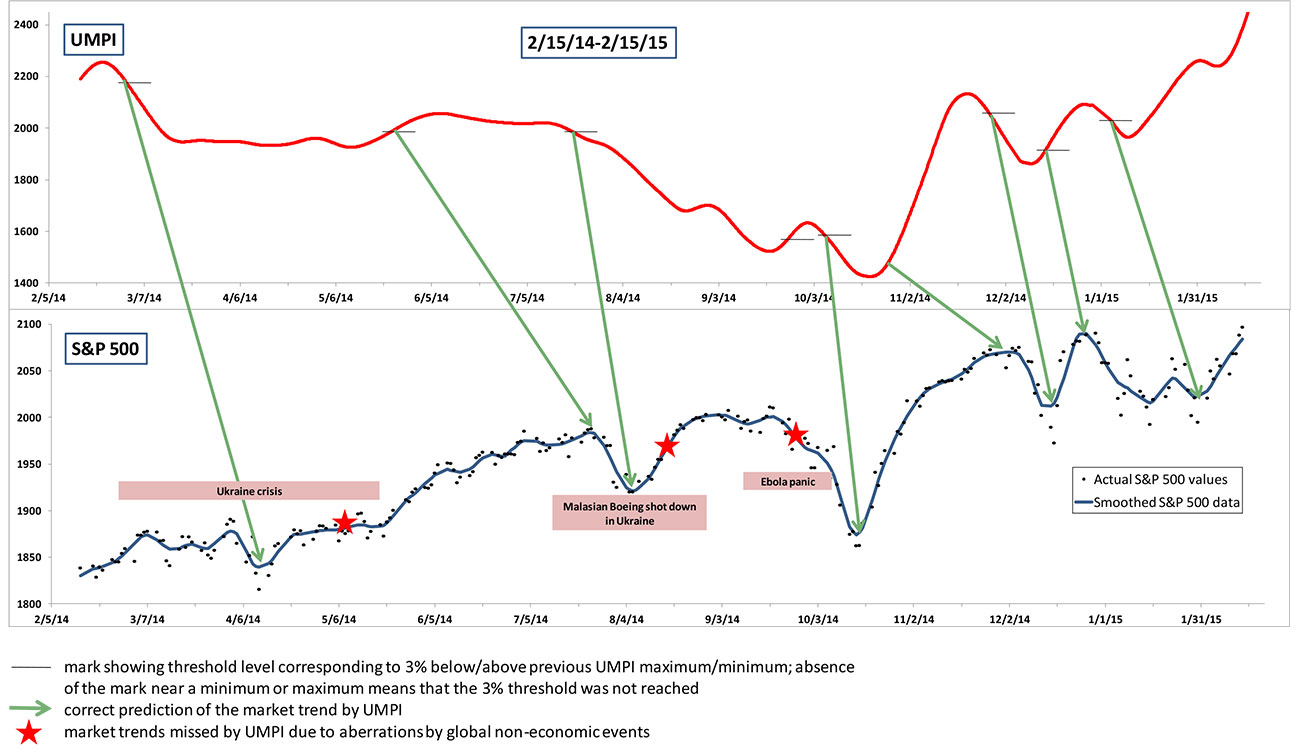
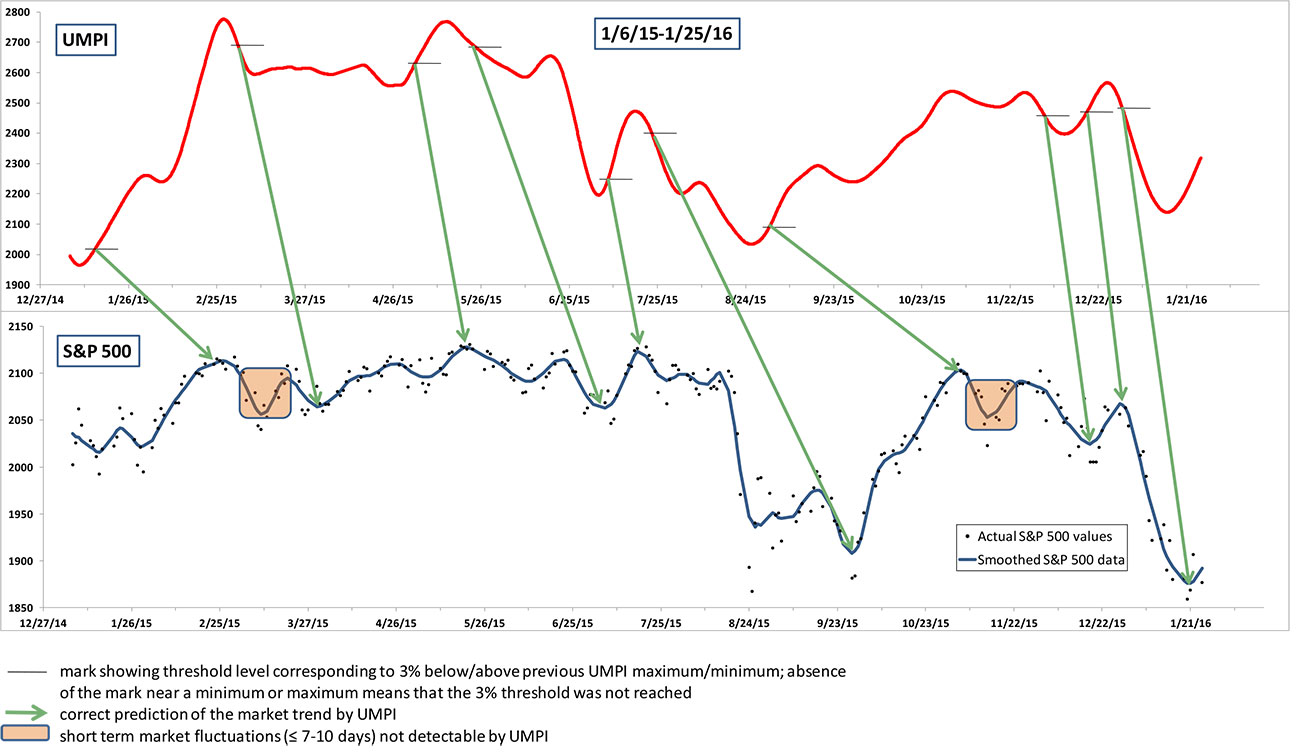
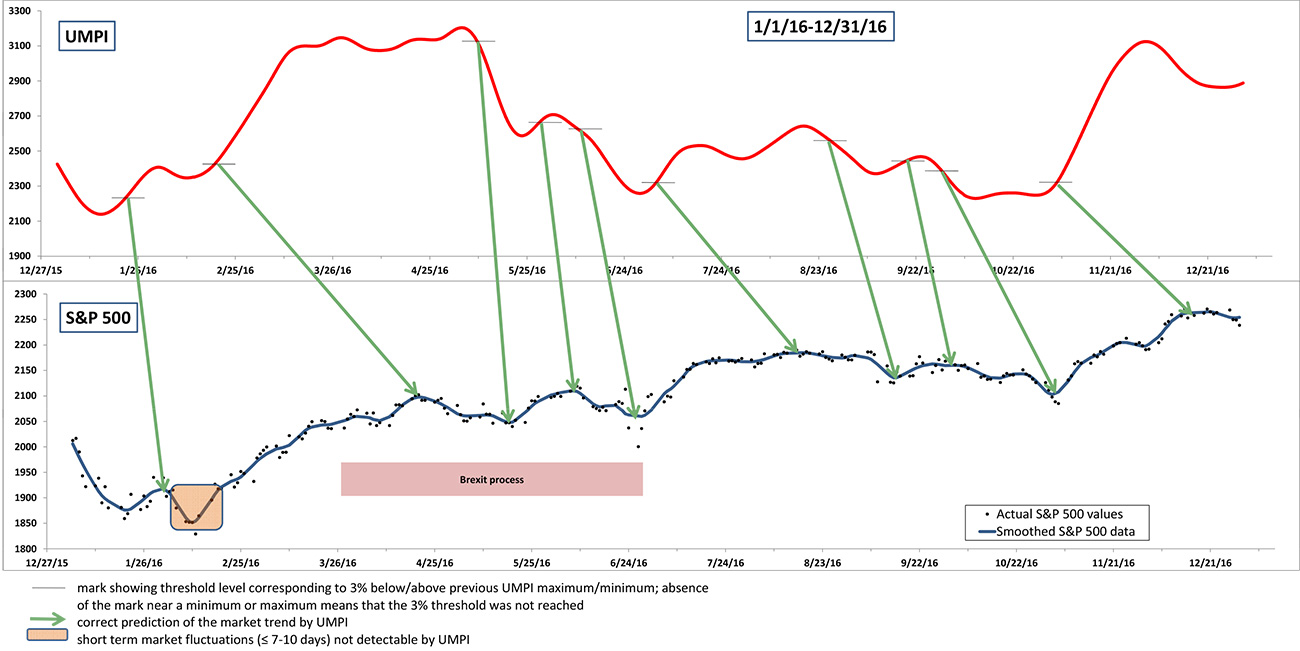
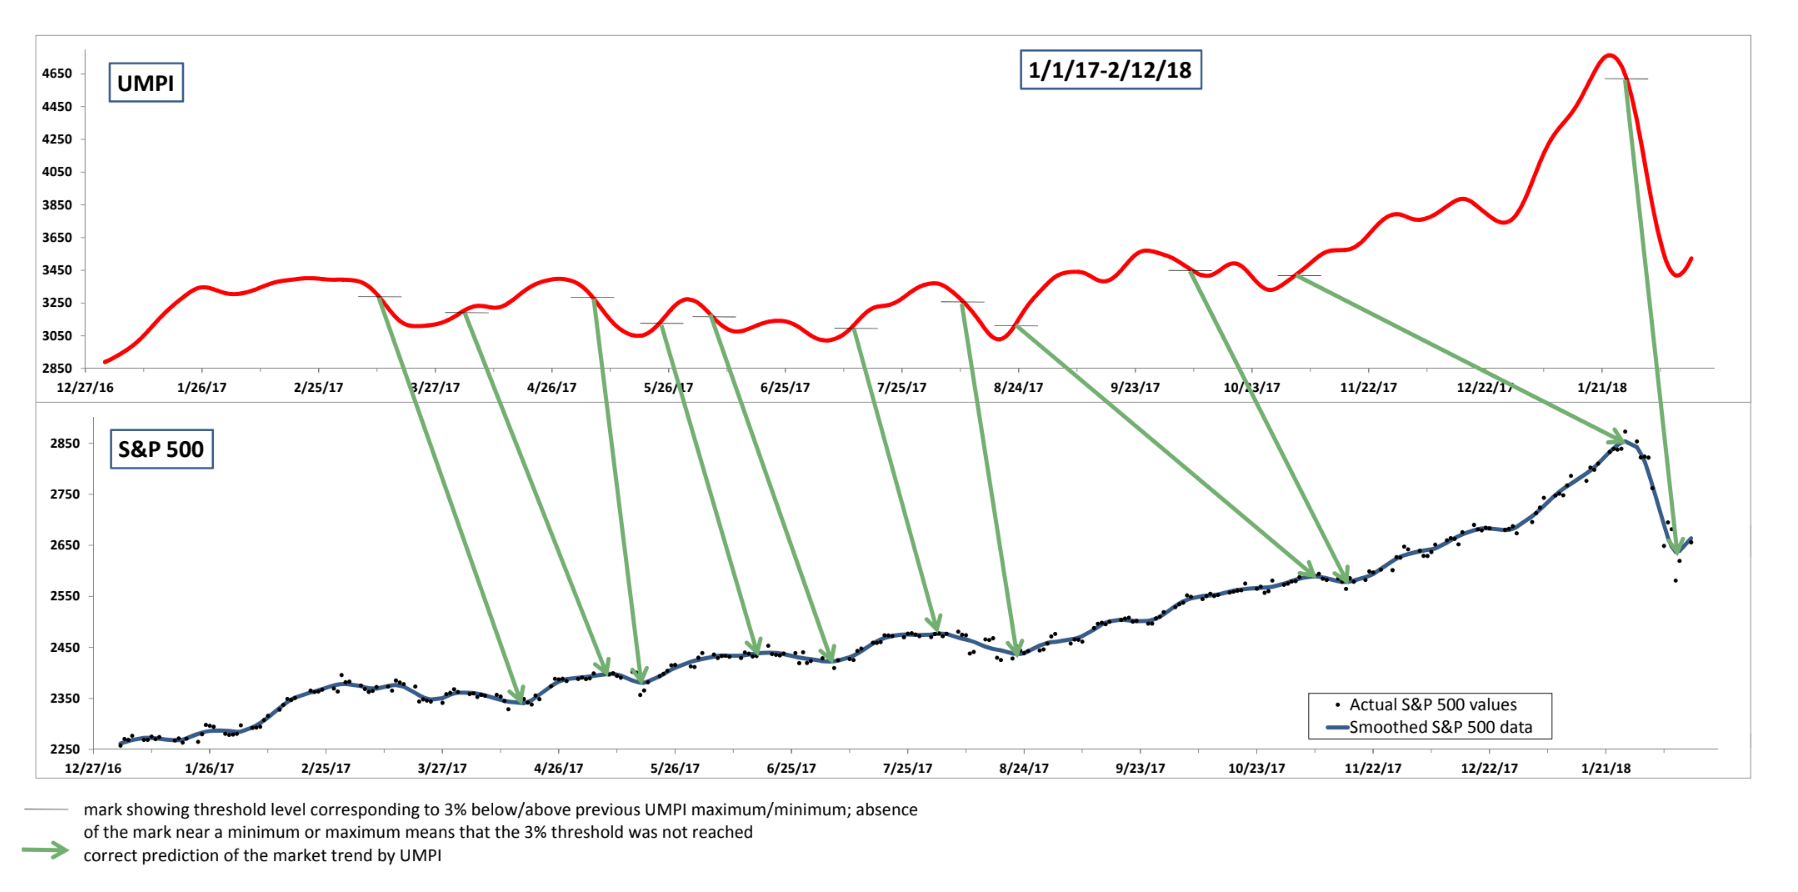
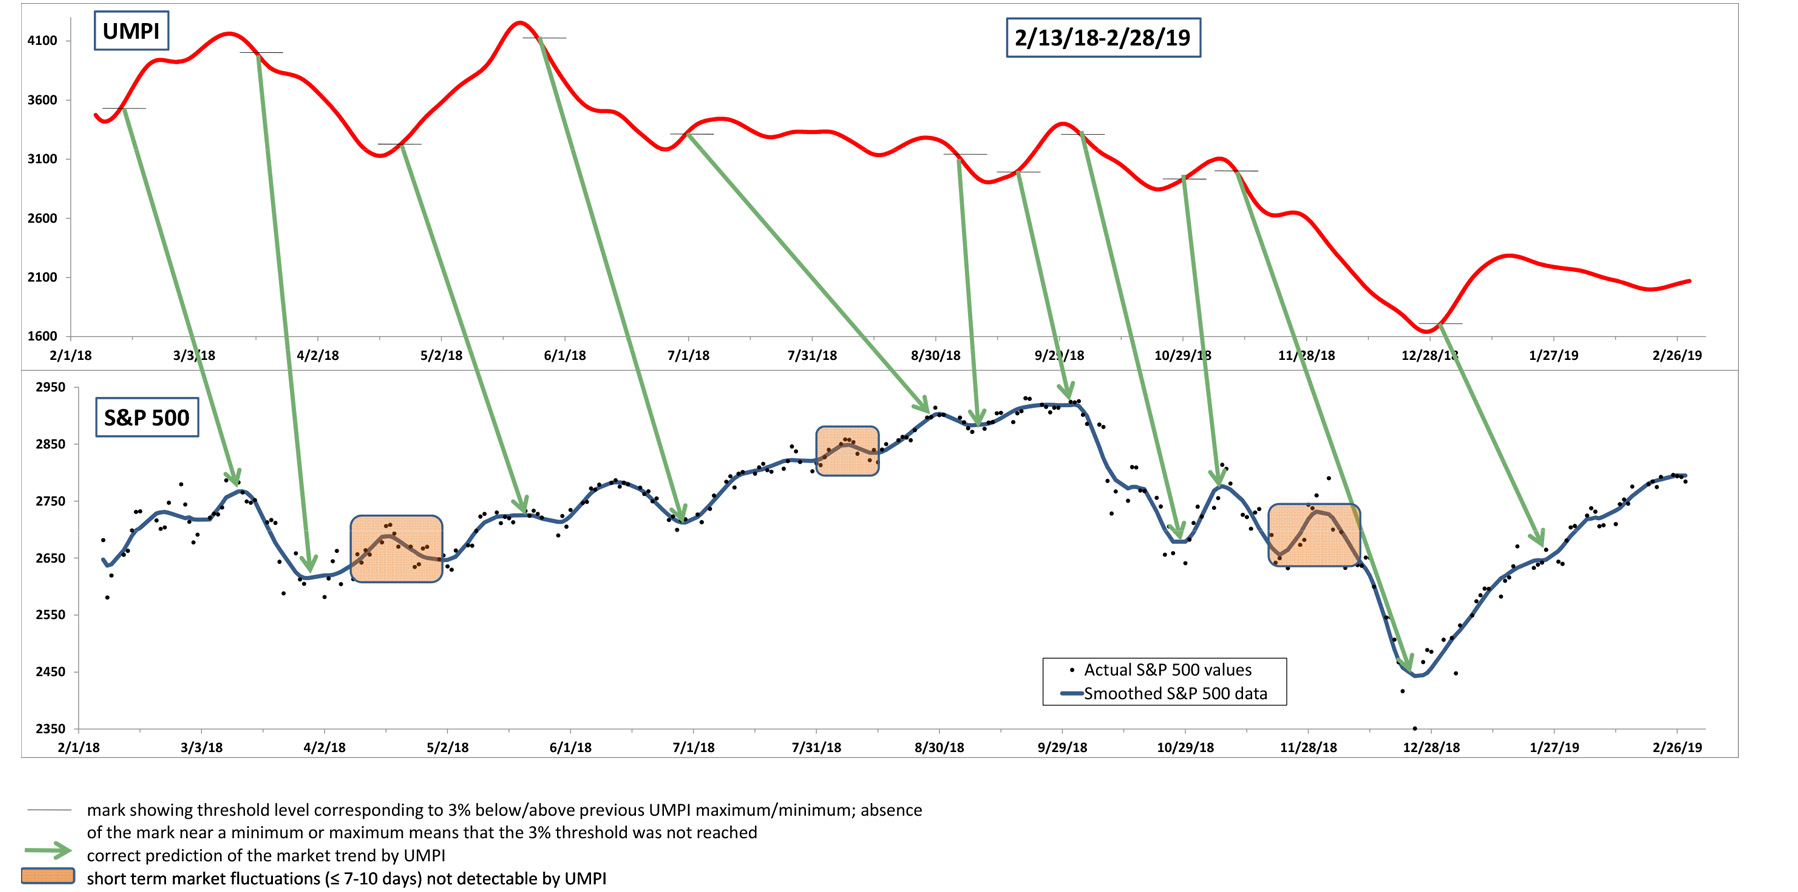
Before offering UMPI as a service to the investor community, we have tested it for several years to confirm its accuracy. The results of our test period are presented in the series of diagrams, which shows UMPI variation over time side by side with historical data for the broad S&P 500 market index. The historical data show that in the vast majority of cases (with a few exceptions discussed in more detail later) UMPI consistently and correctly predicted market moves. Specifically, over the four years of observation (2013-2016) UMPI correctly predicted 34 of 38 occurrences of S&P 500 trend changes, which is an impressive 90% success rate.
Watch UMPI in action:

If UMPI shows a consistent trend upwards, breaking through the threshold level corresponding to approximately 3% above the previous UMPI minimum, this provides an indicator that the market is likely to rise.
Likewise, if UMPI shows a consistent trend downwards, breaking through the threshold level corresponding to approximately 3% below the previous UMPI maximum, this provides an indicator that the market is likely to fall. The 3% threshold levels are marked in the historical diagrams by short horizontal lines. In most cases, UMPI breaks through the 3% threshold a few weeks in advance of the actual rise or fall in the stock market, thus providing a reliable prediction for market moves.Reaching the approximate 3% threshold should not be mechanically viewed as a "sell" or “buy” signal for stocks - it rather should be considered an alert that the market is likely to change direction. After breaking through the threshold UMPI should be closely monitored to confirm that the emerging trend is stable.
An example of UMPI application for investment management, resulting in significantly improved investment growth, can be found here.
Sign Up & Get Started >
Please read our FAQ for important information on functionality and use of UMPI.
Examples of Historical UMPI Diagrams
 Click to enlarge
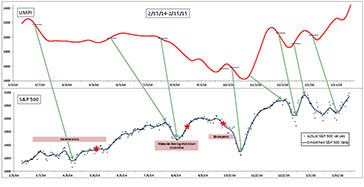 Click to enlarge
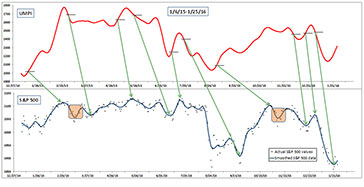 Click to enlarge
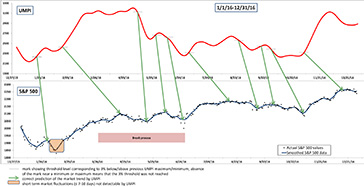 Click to enlarge
 Click to enlarge
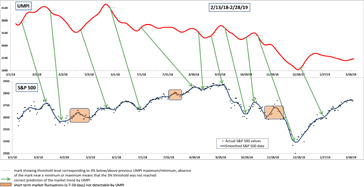 Click to enlarge

Customer Testimonial
“My experience with UMPI has been positive from the get-go. The team behind it are responsive and friendly, and the tool itself is very impressive. Especially considering the lengthy free trial, I'd certainly recommend trying it out to anyone.”
— Jonathan
“You have a very, very, very cool tool! Period.”
— Dino
Payment Methods

We're Secure
![]()
Follow Us
![]()
![]()